

Event History
The Event History section provides a detailed record of all events detected by the system over a selected time period.
Event history
-
Click Event history to view events that occurred within a specific time frame.
- Show/Hide filter: Enable the following options.
Dimension type: Allows you to select dimension types and apply filters based on the configured dimensions of the metric.
Date range: Allows you to select the desired date range for viewing events.
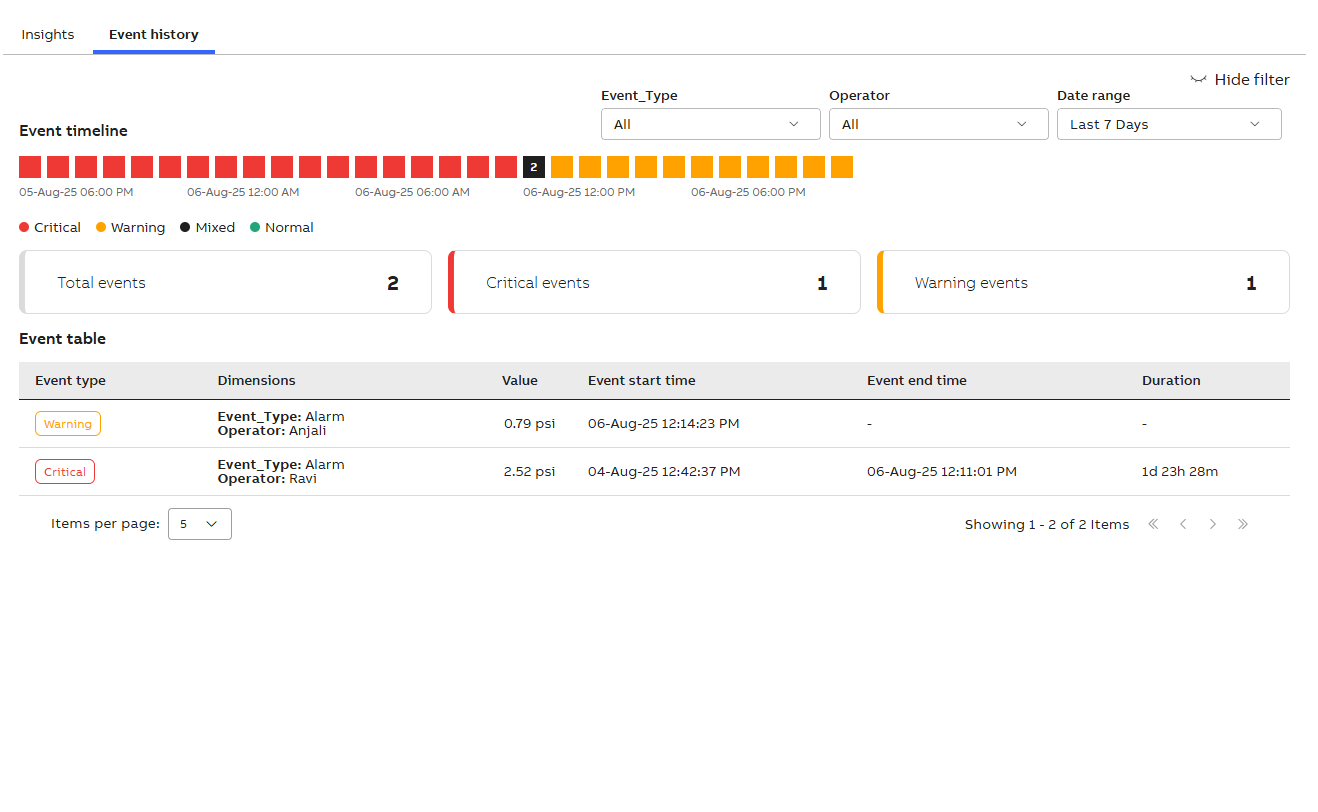
Event timeline
The Event timeline provides a chronological visualization of key events, including their types and corresponding dates.
The legend visually distinguishes event types using color codes:
-
Critical events - Red
-
Warning events - Yellow
-
Mixed events - Black
-
Normal events - Green
Display tiles
-
Total events: It displays the total number of events recorded during the selected time frame.
-
Critical events: It displays the number of high-severity events logged by the system in a given period.
-
Warning events: It displays the number of moderate-severity events detected during the selected period.
Event table
|
Fields |
Descriptions |
|---|---|
|
Event type |
The system categorizes events into the following types:
|
|
Dimensions |
Leverage up to two dimensions to segment and analyze data. |
| Value | It represents the numeric result of the calculated metric associated with the event. |
| Event start time |
Indicates the exact date and time when the event was triggered or first detected by the system. |
| Event end time |
Indicates the exact date and time when the event concluded or was last recorded by the system. |
|
Duration |
Indicates the total length of time an event remained active—from the Event Start Time to the Event End Time. |